
Food Nutrition Apps: What That Score Out of 100 Is Actually Made Of
The Nutrition Facts panel is required to carry four micronutrients out of the 27 the same regulation calls essential in human nutrition. Every food nutrition app that scans a barcode builds on that panel and an ingredient list. And Yuka's score, the one method in this category published in full, is 60% nutrition, 30% additives and 10% an organic bonus. Here's what that single number can and can't carry.
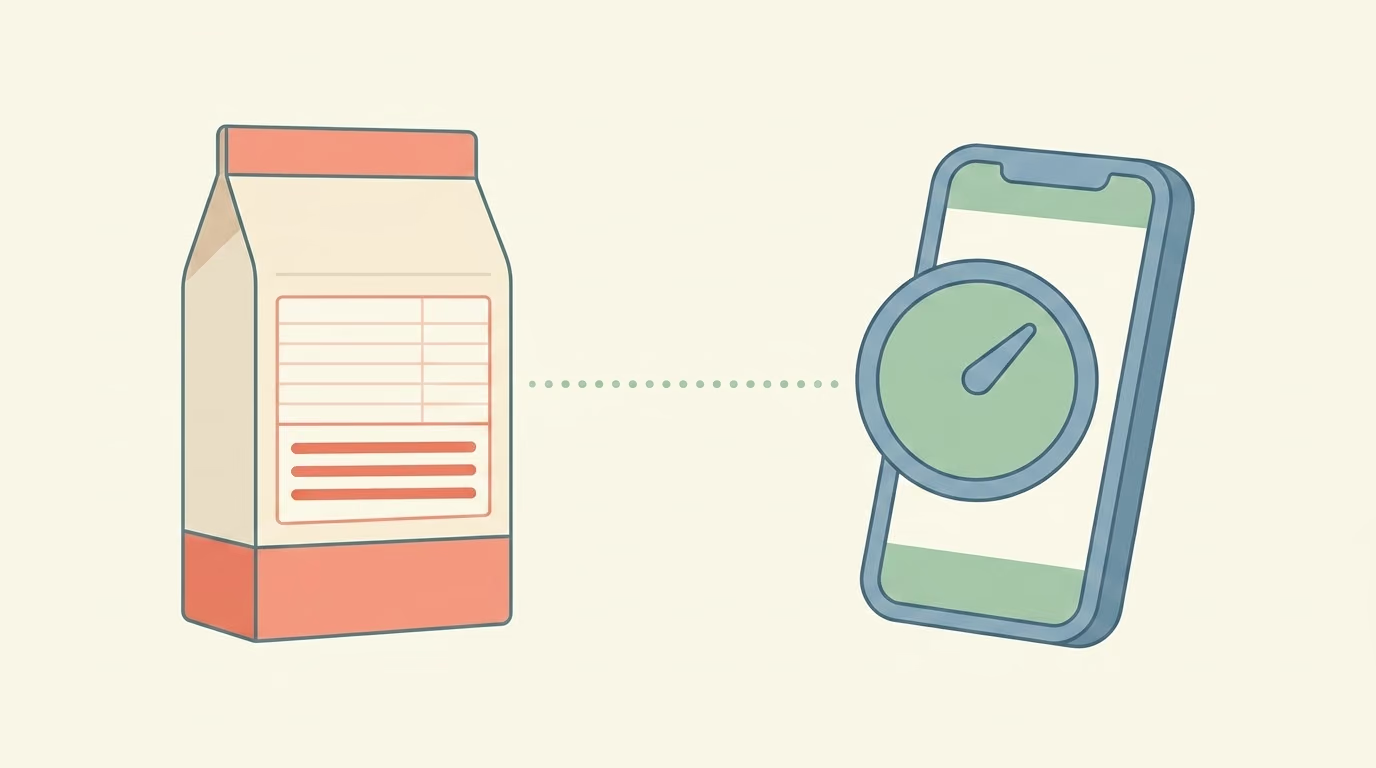
A US Nutrition Facts panel is required to carry exactly four micronutrients: vitamin D, calcium, iron and potassium. The same regulation lists 27 vitamins and minerals that it describes as essential in human nutrition and gives each one a Daily Value. Four of those 27 are mandatory. The other 23 are up to the manufacturer.
Every food nutrition app that works by scanning a barcode is reading that panel and the ingredient list beside it, and nothing else. That means the score it shows you is built on an energy-and-macro panel, an ingredient list, and whatever else the company that made the food decided to print. The four guaranteed micronutrients are in there too, doing no work at all, for reasons we’ll get to.
I build a nutrition app, which you should factor into everything below. The deal I’ll make with you is the same one we made in our comparison of what each nutrition app can count: every claim about another product comes from that company’s own published material or from reporting with the quotes on the record, and there is a section near the end telling you plainly where Tavita is the wrong choice. This isn’t an argument that scanners are bad. It’s an argument about what a single number out of 100 can carry.
View the data as a table
| Nutrient | Status on the label |
|---|---|
| Vitamin D | Required |
| Calcium | Required |
| Iron | Required |
| Potassium | Required |
| Vitamin A | Voluntary |
| Vitamin C | Voluntary |
| Vitamin E | Voluntary |
| Vitamin K | Voluntary |
| Thiamin | Voluntary |
| Riboflavin | Voluntary |
| Niacin | Voluntary |
| Vitamin B6 | Voluntary |
| Folate | Voluntary |
| Vitamin B12 | Voluntary |
| Biotin | Voluntary |
| Pantothenic acid | Voluntary |
| Phosphorus | Voluntary |
| Iodine | Voluntary |
| Magnesium | Voluntary |
| Zinc | Voluntary |
| Selenium | Voluntary |
| Copper | Voluntary |
| Manganese | Voluntary |
| Chromium | Voluntary |
| Molybdenum | Voluntary |
| Chloride | Voluntary |
| Choline | Voluntary |
The 23voluntary nutrients aren’t forbidden from a label. They’re simply not mandatory. A manufacturer may declare any of them, and must declare one if it has been added to the food or if a claim is made about it. So a Nutrition Facts panel is a record of what its maker chose to print, not a ceiling on what a food can be shown to contain: only 4 of the 27 vitamins and minerals with an established Daily Value (Vitamin D, Calcium, Iron, Potassium) are required at all, in that order. Even those may be replaced by a “not a significant source” line when the food holds less than 2 percent of the Daily Value. Reading “magnesium isn’t on this label” as “this food has no magnesium” is the mistake this chart is here to head off.
Sources: 21 CFR 101.9(c)(8), via eCFR, and the FDA’s guide to understanding and using the Nutrition Facts label, whose own sample label carries exactly Vitamin D, Calcium, Iron and Potassium. Read 23 August 2026.
What is a Nutrition Facts panel required to carry?
The relevant text is 21 CFR 101.9, and it’s unusually blunt. Paragraph (c)(8)(ii) says the declaration of vitamins and minerals “shall include vitamin D, calcium, iron, and potassium in that order.” Paragraph (c)(8)(iv) then sets out the table of established Daily Values, and that table runs to 27 vitamins and minerals: the four above plus vitamins A, C, E and K, thiamin, riboflavin, niacin, vitamin B6, folate, vitamin B12, biotin, pantothenic acid, phosphorus, iodine, magnesium, zinc, selenium, copper, manganese, chromium, molybdenum, chloride and choline.
The word attached to those other 23 is “may.” They’re voluntary, not forbidden, and that distinction matters and is routinely got wrong. A manufacturer is free to declare magnesium or B12 on the panel, and must declare one of them if it was added to fortify the food or if the package makes a claim about it. Plenty of fortified products do exactly that. What the regulation requires is only those four, and even they can drop off the printed panel: paragraph (c)(8)(iii) lets a manufacturer omit any of the four present at under 2 percent of its Daily Value, replacing the figure with a “not a significant source” line at the foot of the table.
So a barcode scanner isn’t blind to magnesium by design; it’s blind to magnesium whenever the manufacturer chose not to print it, which on most packages is what happened. The FDA’s own sample label shows the same four and no others, which is the version most people recognise.
A scanner doesn’t report what’s in the food. It reports what the company that made the food chose to print about it.
How does a food scanner app build its score?
Here’s the part almost nobody writing about these apps mentions: Yuka publishes its formula. In full, in its own help centre, with the weightings stated as percentages. That level of detail isn’t the norm here. Yuka’s own chief executive describes the apps in this category as varying in transparency, and hers is at the open end of that range. The fact that one of the most-criticised apps is also the one you can actually audit is worth sitting with before you read the next few paragraphs.
Per Yuka’s published method, a food score is three things added together. “Nutritional quality is 60% of the score,” calculated using Nutri-Score, which counts sugar, sodium, saturated fat, calories, protein, fibre and fruit and vegetable content. Yuka describes that last one as “(calculated or estimated),” because it isn’t on the label either. “The presence of additives is 30% of the score.” “The organic dimension is 10% of the score.” And one override sits above all three: “If an additive we consider to be high-risk is present, the maximum score for the product is set at 49/100. In this situation, this criterion can represent more than 30% of the score.”
View the data as a table
| Component | Share of score | What it measures |
|---|---|---|
| Nutritional quality | 60% | Calculated from Nutri-Score: sugar, sodium, saturated fat, calories, protein, fibre, and fruit/vegetable content (that last input is calculated or estimated, not read off the label) |
| Additives | 30% (floor, not fixed) | Presence of additives Yuka classes as risky. Not a fixed weight: one high-risk additive caps the whole score at 49/100, so this share can end up mattering more than 30% |
| Organic bonus | 10% | Bonus applied when the product carries organic certification |
Yuka states the additive weighting plainly: “If an additive we consider to be high-risk is present, the maximum score for the product is set at 49/100. In this situation, this criterion can represent more than 30% of the score.” So the 30% shown here is a floor, not a fixed weight. A single high-risk additive can make it the whole story. The 60% nutritional-quality share is built from Nutri-Score, and Yuka’s own description says the fruit-and-vegetable content that feeds it is “calculated or estimated” rather than read directly off the label.
Source: Yuka’s own published method for scoring food products, credit to Yuka for making it public. Read 23 August 2026.
Read that composition next to the label ceiling and something odd emerges. The four micronutrients the panel is required to carry aren’t inputs to the score at all. Nutri-Score runs on energy, sugars, saturated fat, sodium, protein and fibre, plus an estimate of fruit and vegetable content. The vitamin D, calcium, iron and potassium figures, the only micronutrients the panel asks for by name, don’t move the number. A scan-and-score app isn’t a micronutrient tool that happens to be limited by the label. It isn’t a micronutrient tool at all.
Two products the same on nutrition, tens of points apart
Because 40 percent of the score comes from additives and organic certification, two products Nutri-Score grades the same can separate by a wide margin on grounds that have nothing to do with sugar, salt, fat or fibre. That isn’t a flaw being hidden. It’s the stated design, and for a reader who wants additives weighted heavily it’s the whole point of using the app. It only becomes a problem when the number is read as a nutrition verdict, which is how the number looks.
How much evidence is behind each part of the score?
The 60 percent is on firm ground. A 2024 systematic review and meta-analysis in the American Journal of Clinical Nutrition screened 4,519 publications and included 29 studies covering nine nutrient profiling systems. Its assessment, verbatim: “The Nutri-Score NPS was assessed as having substantial criterion validation evidence.” Highest compared with lowest diet quality as defined by Nutri-Score was associated with lower risk of cardiovascular disease (HR 0.74, 95% CI 0.59 to 0.93), cancer (HR 0.75, 0.59 to 0.94) and all-cause mortality (HR 0.74, 0.59 to 0.91).
A second line of evidence arrived the same year from the EPIC cohort across seven European countries, where a worse diet score tracked a modestly higher cardiovascular risk. Weigh that one the way you would weigh the disclosure below, though: it is co-authored by the French team that developed Nutri-Score in the first place.
One disclosure belongs right here rather than in a footnote. Dariush Mozaffarian is a co-author of that meta-analysis, and Food Compass, the nutrient profiling system developed by his own group, is one of the systems the same review places in the middle category, with intermediate criterion validation evidence. That doesn’t undermine the finding, and the review was written by thirteen authors across several institutions, but you should know it before you weigh the conclusion.
Note also what those hazard ratios describe. They compare people whose overall diets score well against people whose overall diets score badly, across years of follow-up. They are evidence that the system ranks diets in a way that tracks health outcomes. They aren’t evidence that any individual jar scoring 78 is good for you, and the review’s own conclusion is modest about the field as a whole: “We found limited criterion validation studies compared with the number of NPSs estimated to exist.”
The remaining 40 percent sits outside that evidence entirely. What the meta-analysis validated was nutrient profiling systems (scoring rules built from nutrients) against health outcomes. An additive penalty and an organic bonus aren’t nutrient profiling systems and weren’t among the nine assessed, so the substantial-validation verdict doesn’t extend to them.
That’s not the same as saying those components are wrong; an ingredient judgement can be reasonable without having been tested in a cohort. It means the 60 and the 40 are different kinds of claim wearing the same uniform, and the score adds them together without saying so. Apps that score purely on ingredients, with no nutritional component at all, are running entirely on the 40 percent that this evidence does not cover.
Why do two apps disagree about the same jar?
NPR’s Maria Godoy reported what three apps made of the same organic almond butter in May 2025, and got three answers. Yuka rated it 78 out of 100 and called it excellent. ZOE cleared it. Bobby Approved flagged it as not approved, because it contains cane sugar. Same jar, same ingredient list, same barcode.
Yuka co-founder and chief executive Julie Chapon gave the reporting an explanation that is both candid and exactly right: the differences “often stem from the fact that each app uses its own methodology, with varying degrees of transparency and scientific grounding.” There is no shared standard underneath these numbers. A score out of 100 looks like a measurement because scores out of 100 usually are, but this one is a company’s position on food, expressed numerically.
Godoy also spoke to Jerold Mande of Harvard, who helped design the US Nutrition Facts label, to Lindsay Moyer, a registered dietitian at the Center for Science in the Public Interest, and to Sundus Mahdi at the University of York. Mahdi’s summary of what the research on these apps supports is the most useful sentence written about the category: they “improve nutrition knowledge. But are they enough to improve dietary intake? … Probably not, and definitely not on their own.”
That’s reporting, not data, and it should be read as such: one journalist, one jar, four experts. It’s worth citing because it is the most widely-read piece we found that opened an app up at all, and because the strongest quote in it comes from the founder of the app being examined.
The three kinds of food nutrition app, and what each is for
Almost every complaint about these apps traces back to using one kind for another kind’s job. There are three, and they’re barely the same product.
- Scan-and-scoreYou are standing in an aisle holding two jars and you have four seconds. A scanner is excellent at this: it reads the ingredient list faster than you can, it applies a consistent rule to every product, and consistency is worth a great deal when the alternative is comparing packaging. What it can’t do is tell you whether the food fits your day, because it’s never seen your day.
- Look-up databasesYou want to know what’s in a food, not whether to buy it. Reference databases and nutrient libraries answer this, and they answer it for foods that have no package at all: lentils, sardines, a sweet potato. Our own nutrient library sits in this category and is free to read on the web.
- TrackersYou want to know what was in your whole day, or your whole fortnight. This is the only one of the three that can answer a question about you rather than about a product, and it is also the only one that requires real effort from you. Coverage varies enormously between trackers, which is the subject of our comparison piece.
The panel you can read without any app
Here’s the quietly useful consequence of the formula being public. Every input Nutri-Score uses, apart from the fruit and vegetable estimate, is printed on the panel in front of you: calories, saturated fat, sodium, sugars, fibre and protein. The 60 percent that carries the evidence is computed from six printed numbers plus that one estimate. You don’t need a phone to compare two products on sodium per serving, and the comparison is more informative than the difference between a 71 and an 84, because you can see which line moved.
Speaking to NPR for the same piece, Dariush Mozaffarian of Tufts offered three ratios that work directly off those printed lines. He looks for at least 1 gram of fibre per 10 grams of carbohydrate, a ratio he says “gives an overall sense of carbohydrate quality”. One cup of blackberries runs 8 grams of fibre against 14 of carbohydrate. He looks for as much potassium as sodium or more, “because potassium directly offsets the harms of sodium.” And he treats saturated fat as worth watching when it exceeds about a third of a food’s total fat.
Note what the second one implies: potassium and sodium are both nutrients the panel asks for by name, so on most packages the single most useful ratio here is one you can work out on the spot. This is the same Mozaffarian whose interest in Food Compass is disclosed above.
Serving size is the trap, and it is the one thing no score protects you from. Two products only compare if the serving sizes match, which they frequently don’t. If you want the reference figures those percentages are measured against, our nutrient reference pages list intakes and upper limits per nutrient, and our methodology page sets out where each number comes from.
The barcode blind spot
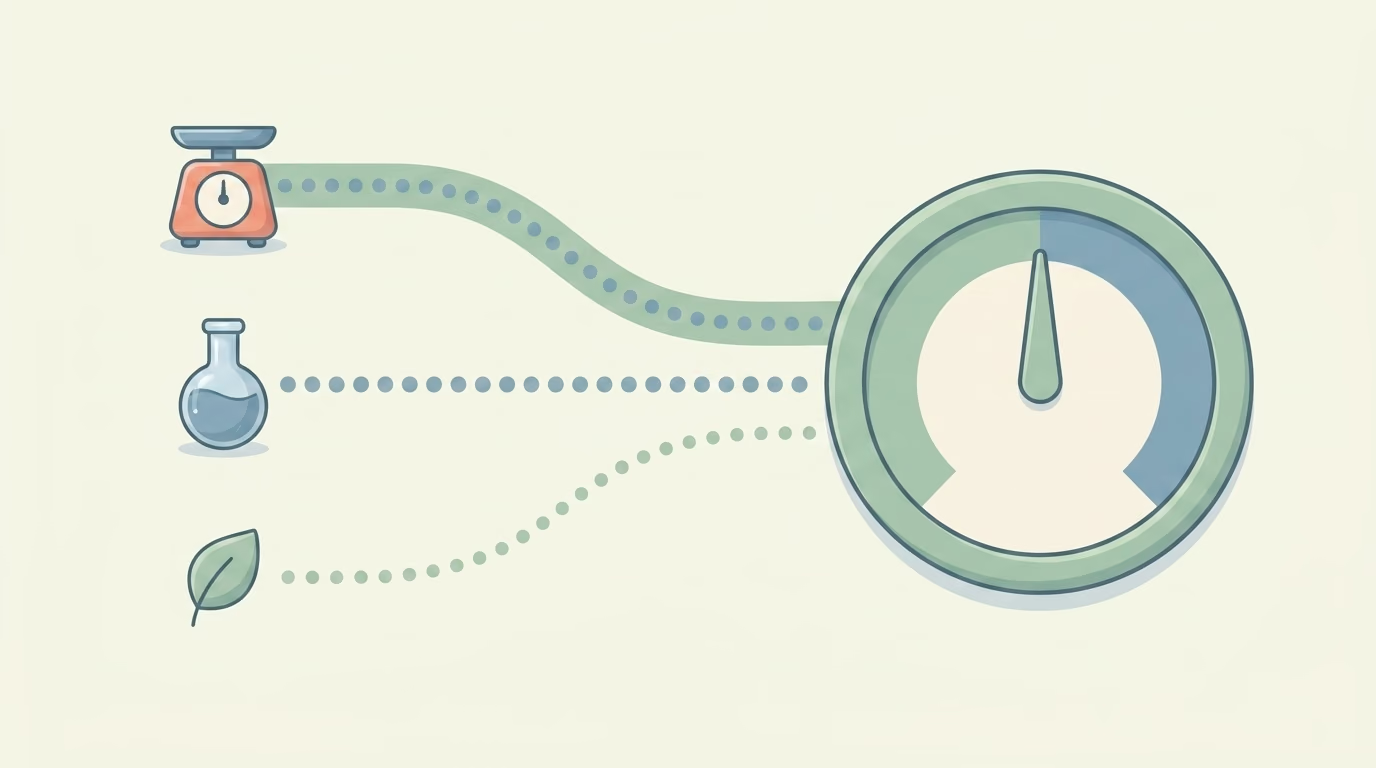
Every one of these apps shares a limitation that has nothing to do with software. A scanner needs a barcode, and a score needs a panel to read. Loose produce, a fillet from the fish counter, dried beans from a bulk bin, an egg, a bunch of parsley: the foods with the least printed on them are the ones the app has the least to say about. Meanwhile the shelf full of scannable products is the one it can rank in exhaustive detail.
The practical effect is a tool that is most articulate about the part of the shop where the differences matter least, and silent where they matter most. That isn’t a criticism of any particular app. It’s what happens when the input is a label. Mozaffarian put the same point in one line to NPR: the healthiest foods, like fruits and vegetables, often don’t come with a barcode at all.
Where Tavita is the wrong choice
If your question is “should I buy this packaged product,” a free scanner answers it faster than we do, and you should use one. Yukais the obvious choice, and it earns the recommendation on the thing this article has been examining: it publishes its method, so you can decide whether you agree with the weightings before you trust the number. If you’d rather have the raw data than a verdict, Open Food Factsis an open, collaborative product database that you can query without accepting anyone’s scoring at all.
We don’t have a barcode-scoring product and aren’t building one. Tavita answers different questions: what was in your day, how your supplements stack on top of it, and whether your medicines and supplements clash. It also asks you to log every meal, which a scanner doesn’t. For a single jar in an aisle, that’s a worse trade.
Where Tavita earns its keep is when you take medicines or several supplements. The app flags the most serious combinations for free, with no account, and our methodology page sets out where our nutrient numbers come from and where they stop being reliable.
Where we think Tavita earns its place
Tavita reads a meal from a photograph and tracks 33 nutrients and compounds underneath the calorie total, 28 of them vitamins and minerals. That’s where the 23 voluntary label nutrients stop being an abstraction, because magnesium, zinc, folate and B12 are exactly the ones a packaged product routinely leaves off. Then its supplement tracker counts your supplements against the same reference intakes and upper limits as your food, rather than treating them as a separate checklist. And its drug interaction checker checks each medicine and supplement you add against the rest of your list.
The honest limitation runs the other way: a photo estimate is a guess about a portion, and we have written at length about how accurate AI calorie apps really are, including a 2026 study in npj Digital Medicine that measured the photo app SNAQ against doubly labelled water, a physiological reference rather than a database one, and found it underestimated energy intake by 25 percent. That finding applies to the method our own app uses, so we are not exempt from it. A scanner reading a printed panel is more precise about a single packaged product than we’ll ever be. It’s reading, and we’re estimating.
Common questions
What is the best nutrition app?
There's no single answer, because the apps are built for three different questions. A scan-and-score app such as Yuka triages a packaged product in about two seconds. A look-up database answers what is in a food before you buy it. A tracker answers what was in your whole day. Asking a scanner to do the third job, or a tracker to do the first, is where most disappointment comes from. Worth knowing: we couldn't find a peer-reviewed study comparing consumer food-scoring apps head to head, so anyone ranking them is ranking on features and judgement, not on measured accuracy.
How does a food scanner app work out its score?
Yuka is the one that publishes its formula, so it's the one that can be described precisely. Nutritional quality counts for 60 percent of the score and is calculated with Nutri-Score, which uses sugar, sodium, saturated fat, calories, protein, fibre and fruit and vegetable content. Additives account for 30 percent, and an organic certification adds the final 10 percent. One override sits on top: if an additive the company considers high-risk is present, the product is capped at 49 out of 100. Publishing the weightings in that detail isn't the norm in this category, which is the reason a piece like this can describe Yuka's number and not its rivals'.
Are food scanning apps accurate?
Accurate about what is the question. A scanner reads the Nutrition Facts panel and the ingredient list, so it reproduces those faithfully. Whether the score it builds on top is a good verdict is a separate matter, and the components carry unequal evidence: the nutritional-quality part rests on Nutri-Score, which a 2024 meta-analysis in the American Journal of Clinical Nutrition rated as having substantial criterion validation evidence. The additive and organic components aren't nutrient profiling systems and weren't among the nine that review assessed, so that verdict doesn't extend to them. We couldn't find any published study comparing one scanner app against another.
Is there a better nutrition app than MyFitnessPal?
Better at what MyFitnessPal is good at is difficult, because its food database is enormous and that breadth is the product. Better at micronutrients is straightforward, because MyFitnessPal counts six of them. Cronometer publishes a figure of up to 95 nutrients and compounds and has a free tier. Tavita tracks 33 nutrients and compounds, 28 of them vitamins and minerals, from a photo rather than a database search. We went through the whole category in our comparison of what each nutrition app can actually count.
What is the best app for calculating nutritional needs?
Any app that shows a nutrient as a percentage of a Daily Value is doing the same arithmetic the Nutrition Facts panel does, against reference figures published by health authorities rather than calculated for you personally. Those references are age- and sex-banded population values, and an app can't know your labs, your medication or your absorption. Tavita's nutrient reference pages list reference intakes, and upper limits where one has been established, and are free to read on the web without installing anything, which is often all the calculation anyone needs.
The four on the label aren’t the four that run out
Tavita checks your medicines and supplements for interactions and upper limits, and tracks 33 nutrients and compounds under every meal, not just the four on the label.
Get TavitaThe app is free, and you don’t need an account. Or browse the nutrient library first, no download needed.
Sources and corrections
Every claim about another product here comes from that company’s own published material or from reporting with the quotes on the record, and is dated. Yuka’s scoring weights were read on its help centre on 23 August 2026 and the company may revise them. We looked for a peer-reviewed study comparing consumer food-scoring apps against one another and couldn’t find one, so nothing here ranks one scanner as more accurate than another; where the evidence is missing we say so rather than substituting an opinion. If you represent a product named here and something is inaccurate or out of date, email support@tavita.app and we’ll correct it promptly. This article is general information, not medical advice.
- US Food and Drug Administration. 21 CFR 101.9, Nutrition labeling of food. Paragraph (c)(8)(ii) makes vitamin D, calcium, iron and potassium mandatory; paragraph (c)(8)(iv) lists the 27 vitamins and minerals with an established Reference Daily Intake.
- US Food and Drug Administration. How to Understand and Use the Nutrition Facts Label.
- Yuka. How are food products rated? Help centre article, read 23 August 2026. Source of the 60/30/10 weighting and the 49/100 cap.
- Barrett EM, Afrin H, Rayner M, Pettigrew S, Gaines A, Maganja D, Jones A, Mozaffarian D, Beck EJ, Neal B, Taylor F, Munn E, Wu JHY. Criterion validation of nutrient profiling systems: a systematic review and meta-analysis. Am J Clin Nutr 2024;119(1):145-163. Co-author Dariush Mozaffarian’s own system, Food Compass, is rated in this review as having intermediate criterion validation evidence.
- Deschasaux-Tanguy M, et al. Nutritional quality of diet characterized by the Nutri-Score profiling system and cardiovascular disease risk: a prospective study in 7 European countries. Lancet Reg Health Eur 2024;46:101006. EPIC cohort.
- Godoy M. Using an app to rate food for nutrition? Take the results with a grain of salt. NPR, 26 May 2025. Source of the almond butter comparison and the on-record quotes from Julie Chapon and Sundus Mahdi. Cited as reporting, not as data.
- Open Food Facts, the open collaborative food product database, and Yuka, both named above as better answers than ours to a specific question.
- Tavita’s own figures (33 nutrients and compounds, 28 of them vitamins and minerals) are listed nutrient by nutrient in our nutrient library, with the derivation on our methodology page.